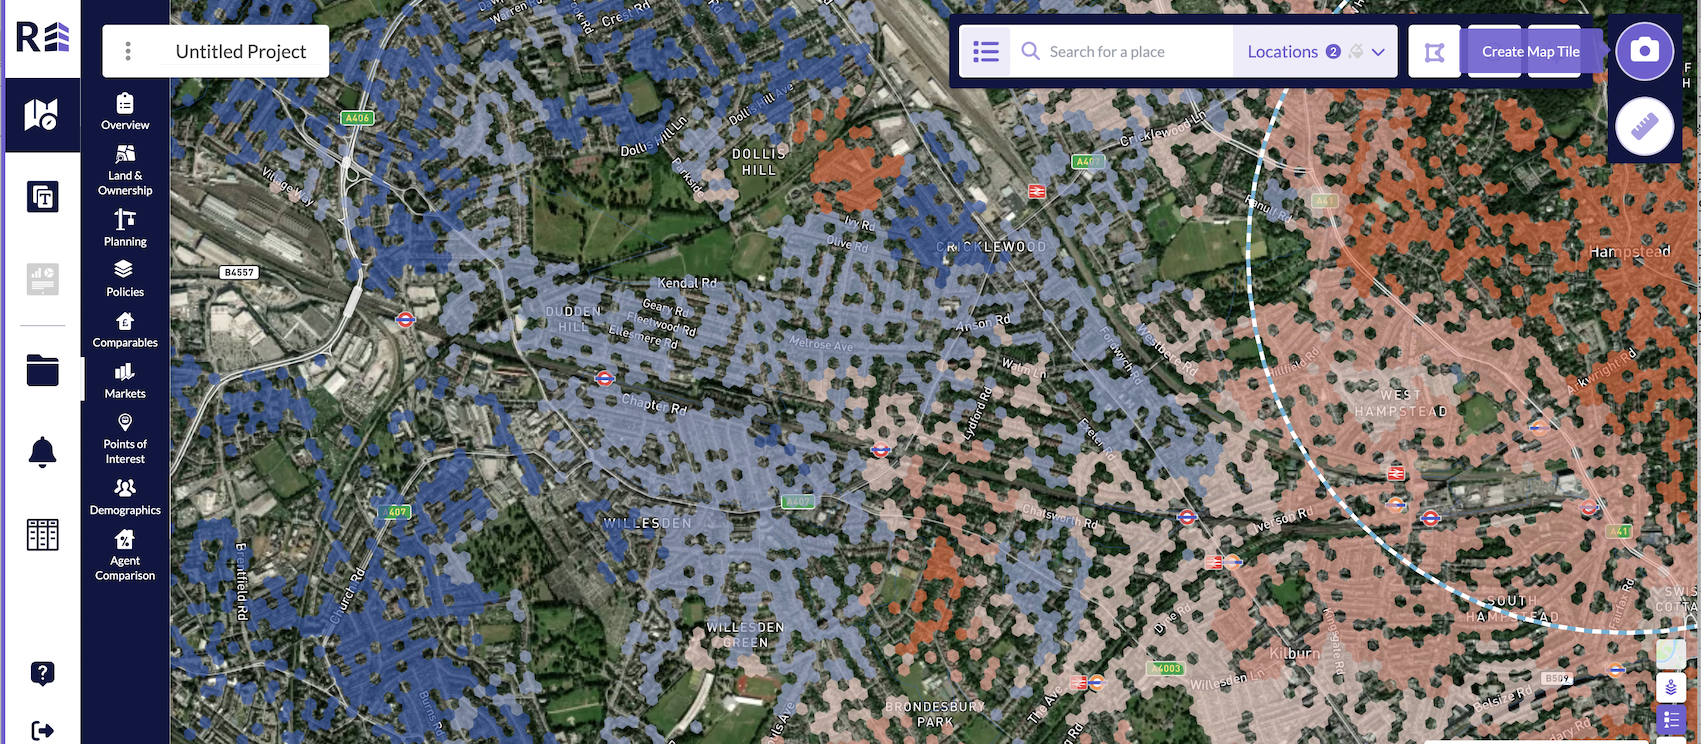
Once you have selected your sales indicator, hit apply and can see the heatmap visualisation overlaid, click the camera icon in the top right hand corner of the platform, take a screenshot of your map and add it to the relevant section of your dashboard.
Was this article helpful?
That’s Great!
Thank you for your feedback
Sorry! We couldn't be helpful
Thank you for your feedback
Feedback sent
We appreciate your effort and will try to fix the article