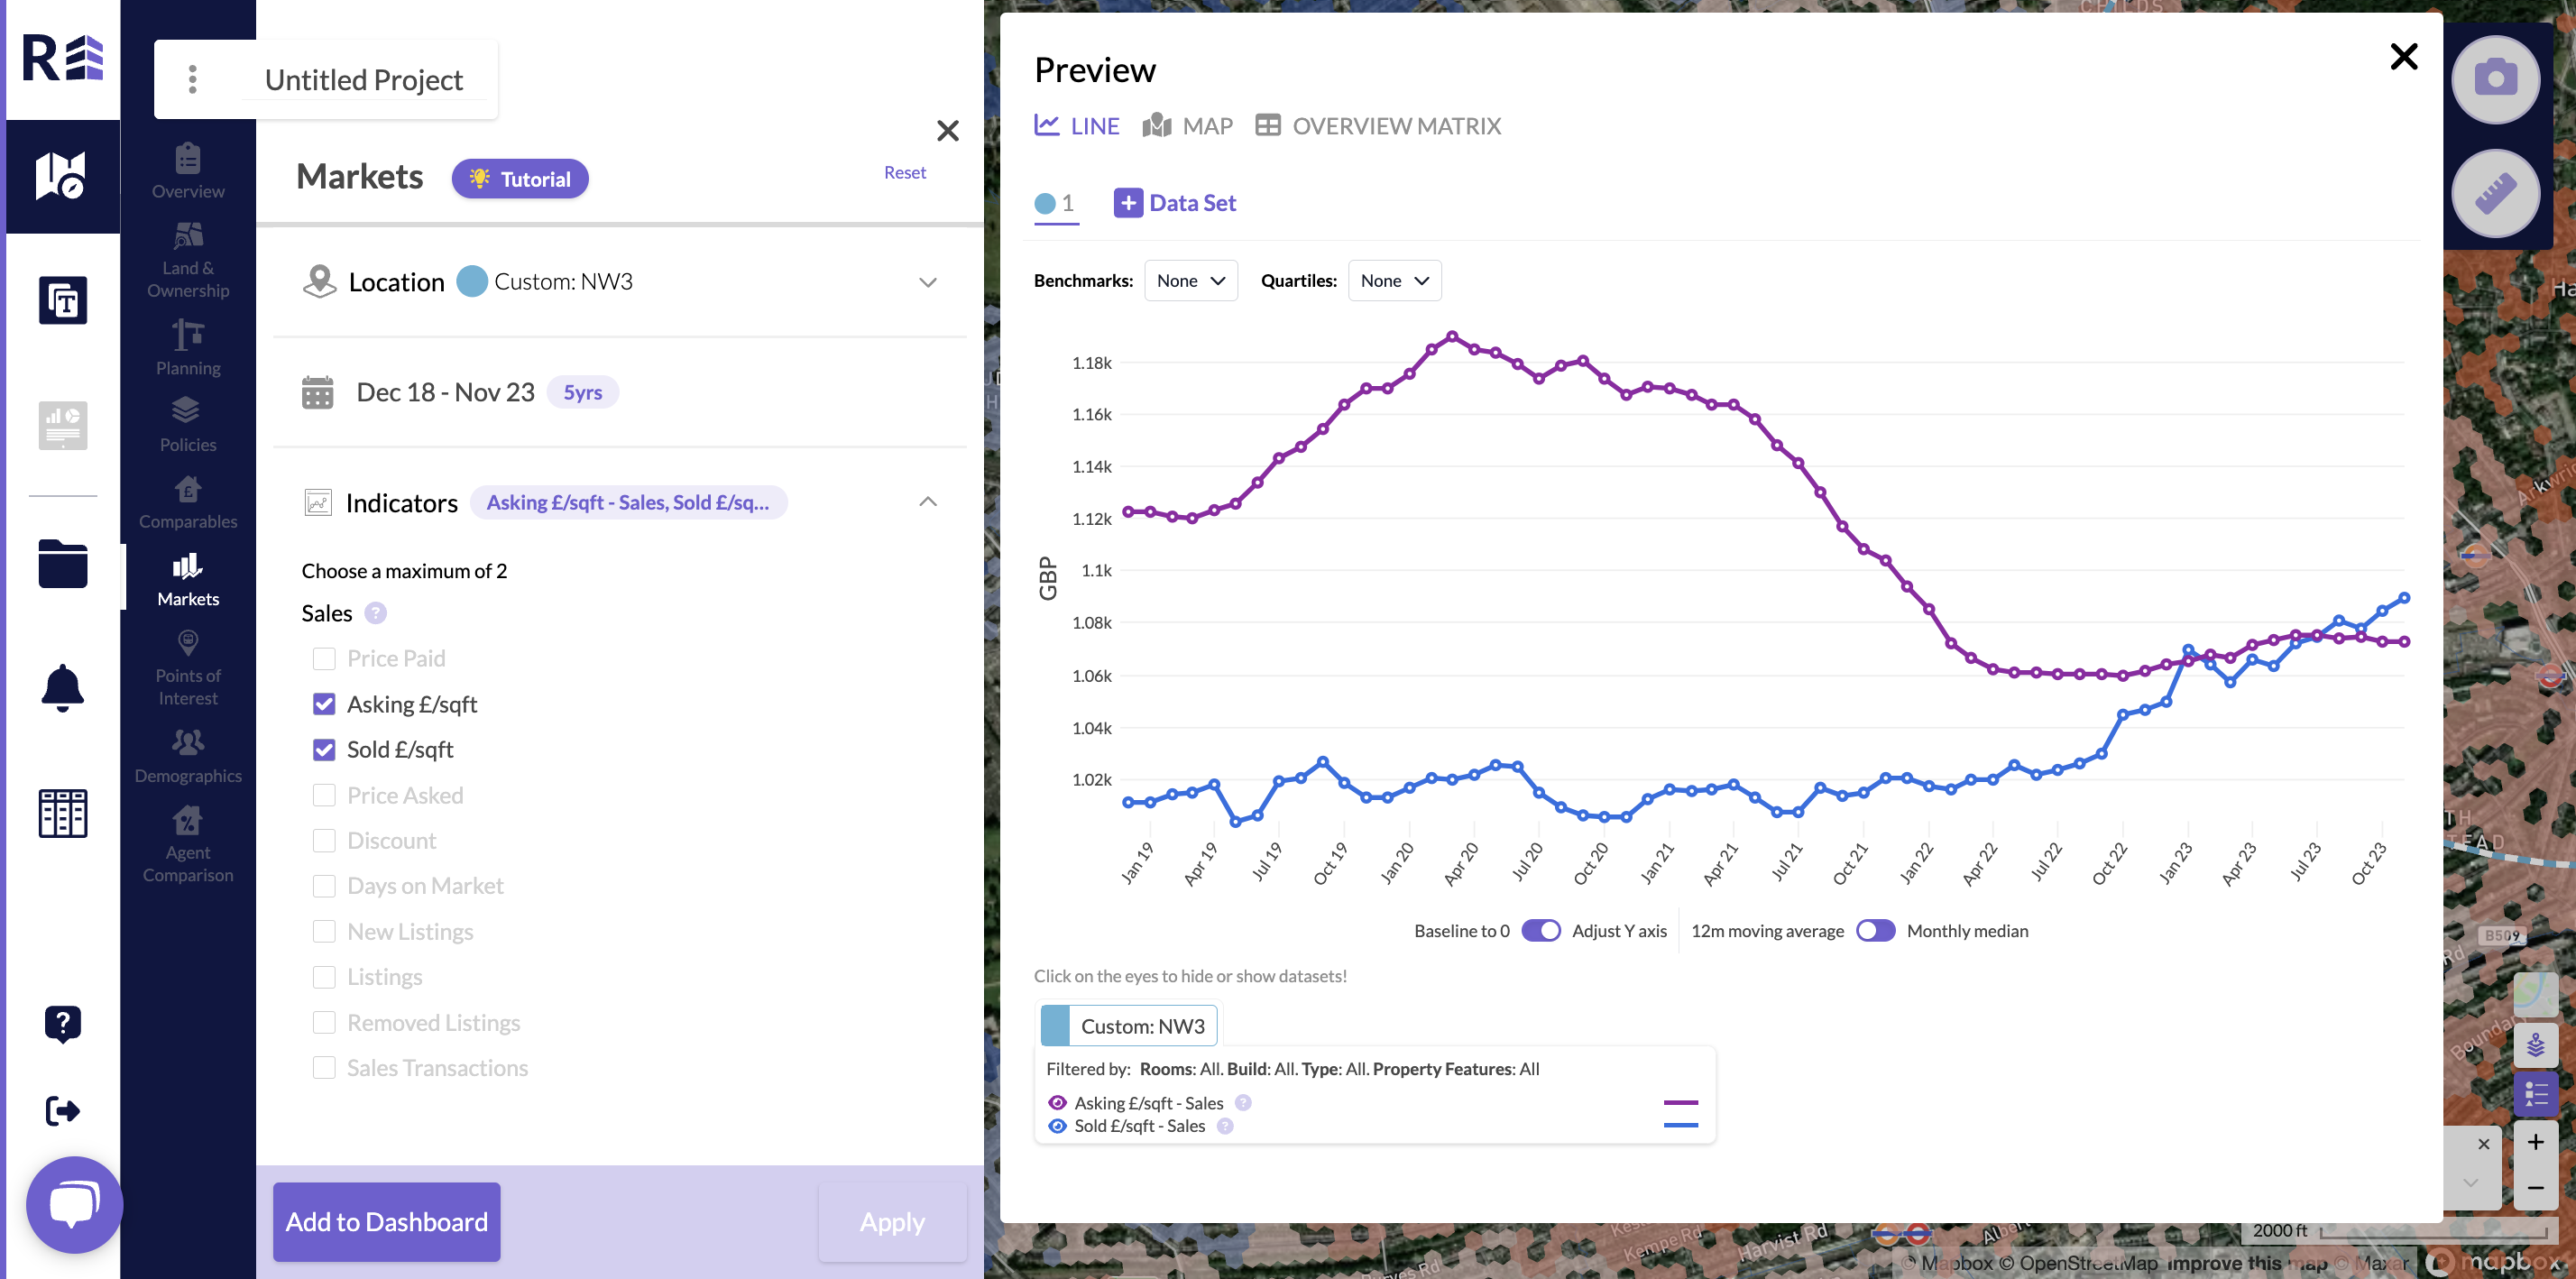
Start by selecting the time period you want to view data on, then select the two sales indicators you would like to view/measure and hit apply. A graph will become visible below the filters showing the trends on a monthly basis.
Was this article helpful?
That’s Great!
Thank you for your feedback
Sorry! We couldn't be helpful
Thank you for your feedback
Feedback sent
We appreciate your effort and will try to fix the article